How Reliable Is On-Site Power? – Availability, Outages and Nines

Vendors love to quote on-site power reliability numbers. Ninety-seven percent. Ninety-eight percent. "Five nines." The numbers sound reassuring until you ask what they mean in hours, or what exactly was counted. A generator that is 98% available can still be down for a week a year, and a plant built from those generators can be far better or far worse depending on how it was designed. How reliable is on-site power, and how do you tell good numbers from marketing?
Well-designed on-site power can be very reliable, but single units are not: a typical gas engine or turbine is available roughly 93% to 98% of the time, and high plant reliability comes from adding spare units, protecting the fuel supply and maintaining everything well. On-site power reliability is usually measured as availability, the share of hours a unit or plant can deliver power.
A plant with enough spares can reach well above 99.9% for its generation, while a plant with no spares is only as good as its weakest unit multiplied many times over. The real limits often come from shared weak points like a single gas line or switchgear bus, not the engines themselves.
What Is the Difference Between Availability and Reliability?
They are related but not the same. Availability is the share of time a unit or plant is able to produce power. Reliability is the chance it keeps running without a failure over a given period. A unit can be highly available but unreliable if it fails often and gets fixed fast. Another can be reliable but less available if it rarely fails but spends a long time in planned maintenance.
Engineers tie the two together with two numbers:
- Mean time between failures (MTBF): the average run time between unplanned stops
- Mean time to repair (MTTR): the average time to get back online after one
Availability (counting only failures) = MTBF ÷ (MTBF + MTTR). For example, if a generator runs an average of 2,000 hours between failures and takes 24 hours to repair, its availability = 2,000 ÷ 2,024 ≈ 98.8%. Cut repair time to 8 hours with spare parts on site, and it rises to 2,000 ÷ 2,008 ≈ 99.6%. Same engine, different maintenance strategy.
How Reliable Are Gas Engines and Turbines?
Good, but not perfect, and the honest numbers include planned maintenance. The U.S. Environmental Protection Agency's Catalog of CHP Technologies lists availability of about 96% to 98% for reciprocating engines and about 93% to 96% for gas turbines in combined heat and power service.
Turn those into hours and they look less impressive. A year has 8,760 hours:
- 98% available: 0.02 × 8,760 ≈ 175 hours down per year
- 96% available: 0.04 × 8,760 ≈ 350 hours down per year
- 93% available: 0.07 × 8,760 ≈ 613 hours down per year
Much of that is scheduled work, like inspections and overhauls, so it can be planned around. But some is forced outages, unplanned trips and failures that arrive without warning. That forced portion is what redundancy has to cover.
What Do the "Nines" of Availability Mean?
"Nines" are shorthand for availability percentages. Each extra nine cuts allowed downtime by a factor of ten. The math is simple: downtime per year = (1 − availability) × 8,760 hours.
- Two nines (99%): about 87.6 hours a year
- Three nines (99.9%): about 8.8 hours a year
- Four nines (99.99%): about 53 minutes a year
- Five nines (99.999%): about 5 minutes a year
The chart below shows the same thing in minutes per year. The drop from two nines to five nines is enormous, and every step costs more to achieve than the one before.
Downtime = (1 − availability) × 525,600 minutes
Illustrative example: arithmetic based on 8,760 hours (525,600 minutes) in a non-leap year.
View the data
| Minutes of downtime per year | |
|---|---|
| 99% (two nines) | 5,256.0 min |
| 99.9% (three nines) | 525.6 min |
| 99.99% (four nines) | 52.6 min |
| 99.999% (five nines) | 5.3 min |
One warning. A plant that is 99.99% available for generation is not the same as a facility that is 99.99% available to its servers. Switchgear, transformers, UPS systems and cooling all sit between the generators and the load, and each has its own failure rate.
How Do Spares Raise Plant Availability?
By making it unlikely that too many units are down at once. Here is a worked example with a site that needs 4 generators, each 97% available, failing independently:
- 4 installed, no spare: chance all 4 are up = 0.97 to the fourth power ≈ 88.5%
- 5 installed (N+1): chance at least 4 are up ≈ 99.15%
- 6 installed (N+2): chance at least 4 are up ≈ 99.95%
Two spare units take this plant from worse than any single engine to better than three nines. That is the core logic of on-site power reliability. You do not get there with a perfect engine; you get there with enough imperfect engines and a design that keeps their failures independent.
The flip side is that bigger plants need more spares to hold the same result, because more units mean more chances for simultaneous failures. A plant needing 20 units with only one spare can be short far more often than a plant needing 4 units with one spare.
Is Five Nines Realistic for On-Site Power?
For the generation alone, it can be, with enough spares and a protected fuel supply. In the simple four-unit model above, adding a third spare cuts the chance of being short to roughly one in forty thousand (about 99.997% available), which is better than four nines. Run the same math with more spares or more independent paths and five nines is within reach on paper.
The problem is that "on paper" assumes independent failures. A single gas supply interruption that lasts two hours costs the plant 120 minutes, which by itself is more than twenty years of five-nines downtime. That is why plants that claim five nines usually back them with a second fuel source, stored fuel, a grid connection or batteries that ride through short events. It is also why careful engineers quote availability for each layer of the system separately rather than one heroic number for everything.
How Does On-Site Power Compare With the Grid?
Differently, not simply better or worse. The bulk grid is enormously redundant, with thousands of generators and many transmission paths. Most outages a customer sees come from the local distribution system: storms, falling trees, damaged poles and equipment failures near the end of the line. The U.S. Energy Information Administration's reliability data show a typical customer losing power for a few hours a year on average, with major storms causing much longer outages in some years.
On-site power removes the long distribution line from the picture but replaces it with a small, local system that must provide its own redundancy. Done well, it can beat the grid at the point of use. Done cheaply, it can be worse. Many critical facilities use both, so each covers the other's bad days.
What Usually Breaks On-Site Power Reliability?
Rarely the engine block itself. More often it is one of these:
- Fuel supply: a single pipeline or a gas quality problem can stop every unit together
- Shared equipment: one switchgear bus, one control system or one battery for starting
- Load steps: sudden large load changes can push small plants into under-frequency trips; how a generator load step is handled matters a lot
- Maintenance gaps: missed oil changes, ignition problems and skipped inspections
- Spare parts: a week waiting for a part turns a small failure into a long outage
- People: wrong procedures and untested changes cause a large share of outages in any critical facility
How Do Operators Keep Availability High?
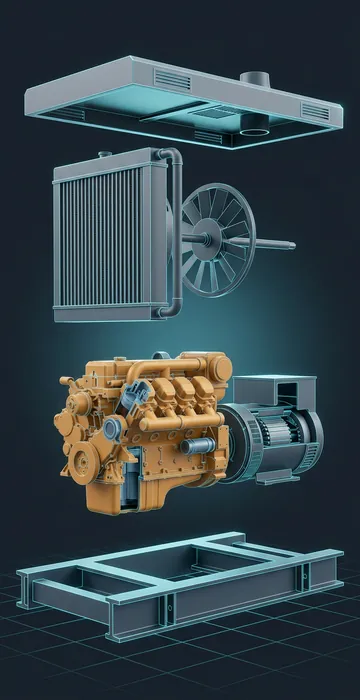
Mostly with unglamorous habits practiced every week. The plants with the best records tend to share the same routines:
- Maintenance by run hours, following the manufacturer's schedule rather than stretching intervals to save money
- Oil analysis and vibration monitoring to catch wear before it becomes a failure
- Critical spare parts on site, chosen from the failure history of the specific engine model
- Remote monitoring of every unit, with alarms that reach someone who can act at any hour
- Regular testing of protection, load shedding and starting systems under real conditions
- Written procedures and training, so the night shift does things the same way as the day shift
None of these show up on a spec sheet, yet they decide whether a plant hits its design availability or falls short. When comparing operators or service contracts, ask to see how each one handles these items, not just the price.
How Should You Judge an Availability Guarantee?
Read the definition before you read the number. Ask:
- Does the figure include planned maintenance, or only forced outages?
- Is it per unit or for the whole plant at the required output?
- What conditions are excluded, such as fuel interruptions, extreme heat or grid events?
- How is it measured, and who keeps the records?
- What happens financially if the target is missed?
A 98% guarantee that excludes planned outages and fuel problems may be worth far less than a 95% guarantee that counts everything.
Nines Are Earned in the Details
On-site power reliability starts with units that are good but imperfect, roughly 93% to 98% available, and builds plant availability through spares, independence and maintenance. Two spares can lift a small plant above three nines; a large plant needs more. Fuel supply, shared equipment and people are where reliable designs usually fail.
When you evaluate a design or a guarantee, translate every percentage into hours per year, ask what was counted, and walk the system for shared weak points. Do that consistently and the gap between real reliability and a good-looking spec sheet becomes obvious.