How Much Does a Data Center Cost per MW? – Shell, Power, Cooling

Every data center budget conversation starts with a single number: dollars per megawatt. It is a handy shorthand, but it hides a lot. Two projects quoted at the same cost per MW can include completely different things, and a number that sounded fine in a pitch deck can blow up once someone asks whether it covers the substation, the generators or the liquid cooling. So how much does a data center cost per MW, and what is inside that number?
A new data center typically costs somewhere in the teens of millions of dollars per megawatt of IT capacity, and Cushman & Wakefield's 2026 cost guide puts the average greenfield build at about $17.6 million per MW. That figure covers the building and its power and cooling infrastructure, but usually not the servers, which can cost far more than the building. Electrical systems tend to be the largest slice, followed by cooling. Facilities built for dense AI hardware cost more; JLL reports AI fit-outs above $25 million per MW.
What Does "Cost per MW" Actually Measure?
It usually means total construction cost divided by the critical IT load the building is designed to support. A 40 MW data center is one that can deliver 40 MW to servers, not one that draws 40 MW at the meter. With cooling and losses, the utility service is larger.
That distinction matters when comparing quotes. Some developers divide by total facility power, which makes the number look smaller. Others include land, utility upgrades or on-site generation, which makes it look bigger. Before comparing any two figures, ask three questions:
- Is the denominator IT MW or total facility MW?
- Does the cost include land, the substation and utility upgrades?
- Is it a powered shell, a fully fitted-out facility or something in between?
How Much Does a Data Center Cost per MW Today?
The best public benchmark is the Cushman & Wakefield 2026 Data Center Development Cost Guide, which puts the average greenfield cost at about $17.6 million per MW, up 21 percent per MW since the firm's previous report. That is an average across markets, so real projects land above and below it.
Here is what that means at common sizes, using the average as an example input:
- 10 MW: 10 × $17.6 million = $176 million
- 50 MW: 50 × $17.6 million = $880 million
- 200 MW: 200 × $17.6 million = about $3.5 billion
Large campuses can gain some economies of scale, but they also tend to carry higher-spec power and cooling systems, so the per-MW figure does not fall as much as people hope.
Where Does the Money Go?
The building itself is the smaller part of the bill. Most of the money goes into the systems that deliver power and remove heat. The chart below shows an illustrative split for a hypothetical air-cooled facility. The percentages are assumptions chosen to show typical proportions, not survey results, and real projects vary.
Hypothetical air-cooled facility, share of construction cost
Illustrative example: assumed shares for a hypothetical air-cooled build; actual splits vary widely by design, density and location
View the data
| Share of cost | |
|---|---|
| Electrical systems | 45% |
| Mechanical and cooling | 20% |
| Shell and site work | 20% |
| Fit-out and soft costs | 15% |
Shell and Site Work
This covers grading, foundations, the structure, roof, walls, roads, fencing and stormwater systems. Data center shells are simple boxes compared to offices, but they carry heavy floor and roof loads, need tight security and often sit on large pads with long utility runs. Poor soils or rock can push this slice up quickly.
Electrical Systems
This is usually the largest slice: medium-voltage switchgear, transformers, UPS systems and batteries, power distribution, backup generators and their fuel systems, and the controls that tie it all together. Redundancy multiplies it. A 2N design, with two complete power paths, needs roughly twice the UPS and distribution capacity of a design with no spare path.
Mechanical and Cooling
Chillers, cooling towers or dry coolers, pumps, piping, air handlers and controls fall here. Liquid cooling adds coolant distribution units, manifolds and secondary piping loops. In hot climates or high-density halls, this slice grows.
Fit-Out and Soft Costs
Fit-out includes containment, cable trays, fire detection and suppression, security systems and the white space finishes. Soft costs include design, permits, commissioning, insurance, financing during construction and developer fees. Commissioning alone can take months of testing on a large site, and it is worth every dollar.
What Might a 50 MW Budget Look Like?
Putting the benchmark and the illustrative split together gives a rough first-pass budget. Example inputs: 50 MW of IT load at the Cushman & Wakefield average of $17.6 million per MW, divided using the hypothetical shares from the chart above.
| Line item | Share | Example cost |
|---|---|---|
| Electrical systems | 45% | $396 million |
| Mechanical and cooling | 20% | $176 million |
| Shell and site work | 20% | $176 million |
| Fit-out and soft costs | 15% | $132 million |
| Total construction | 100% | $880 million |
That total still excludes land, servers, utility upgrades and any on-site generation. On a real project, each of those deserves its own line, and some of them can rival the electrical budget.
Why Do AI Data Centers Cost More per MW?
Because they pack far more power into each rack, and that power has to be delivered and cooled. JLL's 2026 outlook, as summarized by Data Center Frontier, reports AI fit-outs above $25 million per MW and construction costs rising about 7 percent a year from 2020 to 2025.
Seven percent a year compounds. Over five years, 1.07 × 1.07 × 1.07 × 1.07 × 1.07 = about 1.40, so a build that cost $10 million per MW at the start of that stretch would cost about $14 million at the end, before any change in design. Add liquid cooling, heavier floors, bigger electrical rooms per square foot and tighter schedules, and the gap between traditional and AI facilities widens.
What Drives Data Center Cost per MW Up or Down?
Six factors explain most of the spread between projects:
- Redundancy: N+1 costs less than 2N, and certified high-tier designs cost more than basic ones.
- Density and cooling type: air cooling is cheaper per MW at low density; liquid cooling costs more but makes dense racks possible.
- Location: labor rates, permitting, climate and seismic or hurricane design requirements vary by region.
- Scale: bigger buildings spread fixed costs, though equipment cost scales roughly with MW.
- Scope: a powered shell for a tenant costs much less than a turnkey facility with all systems installed.
- Schedule pressure: paying for premium delivery, overtime and pre-purchased equipment raises cost but can save months.
What Does On-Site Power Add to the Budget?
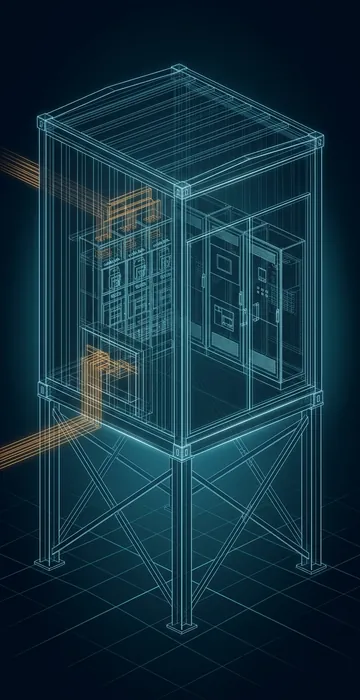
A lot, if the utility cannot serve the site and you need generation that runs every day, not just backup. Here is a worked example with labelled inputs.
Example inputs: 100 MW of IT load, a PUE of 1.3, a 25 percent generation reserve for maintenance and failures, and an installed generation cost of $2,000 per kW.
- Facility load: 100 MW × 1.3 = 130 MW.
- Generation needed with reserve: 130 MW × 1.25 = 162.5 MW.
- Generation cost: 162,500 kW × $2,000 per kW = $325 million.
- Per IT MW: $325 million ÷ 100 MW = $3.25 million per MW.
The $2,000 per kW input is not a quote. The EIA's January 2024 capital cost study by Sargent & Lundy estimated an aeroderivative simple-cycle plant at about $1,606 per kW in 2023 dollars, and EPRI has since reported average gas turbine prices climbing toward $3,000 per kW as orders backed up. Get current vendor pricing before you budget, since turbine and engine prices have moved fast.
That example covers only the generating units installed on site. A real behind-the-meter data center plan also needs a gas lateral and meter station, fuel conditioning, emissions controls to meet the air permit, a switchyard, and often a battery system to handle fast load swings. Each of those carries its own cost and lead time. The good news is that on-site generation can be phased with the load and, in some plans, sold back to a utility or kept as backup once grid power arrives.
How Does Phasing Change the Cost per MW?
Phasing front-loads some costs and spreads others. On a large campus, the first phase usually carries the substation, the main roads, the security perimeter, the water and sewer connections, and sometimes a shell sized for future halls. That makes phase one look expensive per MW.
Later phases reuse that infrastructure, so their cost per MW drops, as long as the original design left room for them. The trap is underbuilding the shared systems to save money early, then paying more to expand them later while live halls are running next door. A good master plan prices the whole campus up front, even if the money gets spent over several years.
Is It Cheaper to Lease Than to Build?
It depends on scale, timing and how long you plan to stay. Many companies never build at all. They lease space from colocation providers, either by the rack or by the whole hall, and pay a monthly rate tied to the power they reserve. That trades capital cost for operating cost and moves construction risk to the landlord.
Large users often split the difference. A developer builds a powered shell or a fully fitted facility to the tenant's specs and leases it back on a long-term contract. The cost per MW still matters in that deal, because it sets the rent the developer needs to earn a return. Whether to lease or own is a financial and strategic decision, so run it past your finance team and advisers rather than deciding on construction cost alone.
What Is Usually Left Out of Cost per MW?
The biggest omission is the IT equipment. Servers, storage and networking are bought separately, often by the tenant, and for high-end accelerated computing they can cost several times the building per MW. Investors who compare data center "cost" across projects need to know which layer they are looking at.
Other common omissions include:
- Land and its carrying cost.
- Utility substations, transmission upgrades and the collateral utilities require.
- Gas pipeline laterals for on-site generation.
- Off-site roads, water and sewer extensions.
- Financing costs beyond the construction period.
How Should You Sanity-Check a Budget?
Start with a benchmark, then adjust line by line. A simple process I use on early budgets:
- Confirm the denominator is IT MW and write down the scope included.
- Compare the total to a published benchmark such as the Cushman & Wakefield average.
- Adjust for density, redundancy and cooling type, which are the biggest technical swings.
- Add separate lines for utility upgrades, on-site power and land if the benchmark excludes them.
- Check equipment lead times, since a long wait for transformers or generators can raise cost through delays.
- Carry a contingency that matches how early the design is; early estimates deserve more.
Cost and time are linked. A project that slips six months pays for extra financing, staff and escalation, which is why schedule deserves the same scrutiny as price. Our guide to data center construction time walks through each phase from land to load.
Data Center Cost per MW Is Only as Good as Its Fine Print
Data center cost per MW is a useful starting point, and Cushman & Wakefield's 2026 average of about $17.6 million per MW is a reasonable benchmark for a greenfield build. Electrical systems usually take the biggest share, cooling comes next, and AI-focused facilities run higher.
Before trusting any number, find out what it includes, especially servers, land, utility upgrades and on-site power. Then adjust for density, redundancy and location, and test the schedule. A budget that survives those questions is one you can take to a lender.